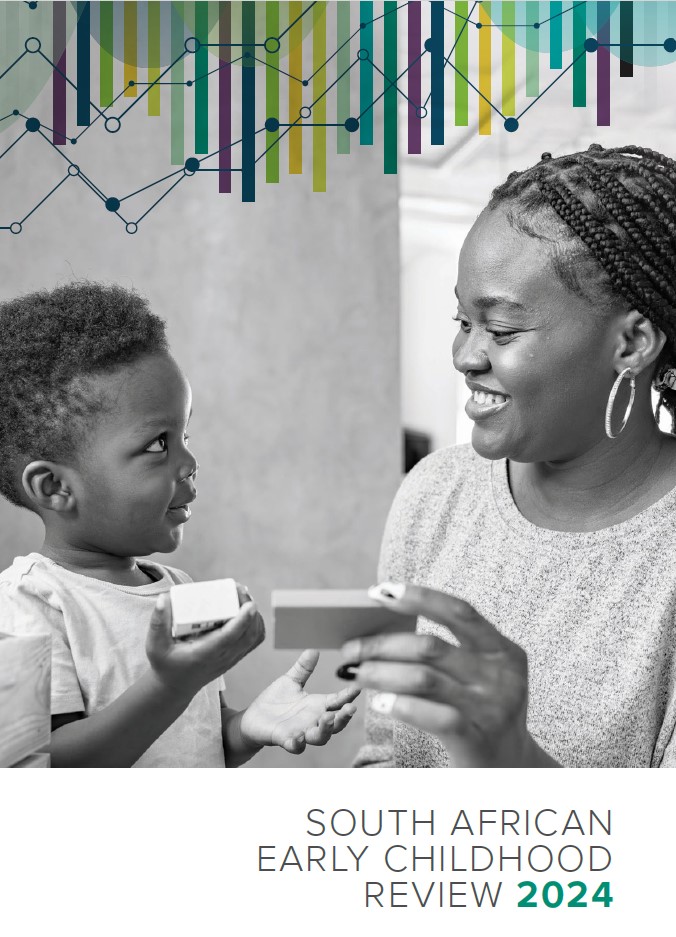
 The SAECR 2024 tracks trends on the status of children under 6.
 Health
This indicator shows the number and proportion of young women aged 15 – 24 who are reported to have been pregnant or given birth to a child in the past year.
Statistics South Africa (2010-2025) General Household Survey 2009-2024. Pretoria, Cape Town: Statistics South Africa.
Analysis by Katharine Hall & Sumaiyah Hendricks, Children's Institute, University of Cape Town
Teenage pregnancy rates are difficult to calculate directly because it is hard to determine how many pregnancies end in miscarriage, still-birth or abortion: these are not necessarily known to the respondent, or accurately reported. In the absence of reliable data on pregnancy, researchers tend to rely on childbearing data (i.e., the percentage of women in an age group who have given birth to a live child).
Despite widespread assumptions that teen pregnancy in South Africa is an escalating problem, the available data suggest that the percentage of teenage mothers is not increasing. A number of studies have suggested a levelling off and even a decrease in fertility rates among teenagers in South Africa.[1-3] Teenage fertility rates declined after the 1996 census from 78 births per 1,000 women aged 15 – 19 years, to 65 births per 1,000 adolescents in 2001. The adolescent birth rate recorded in the 2011 population census suggested an increase to 72 per 1,000, and the 2016 SA Demographic and Health Survey recorded a similar (slightly lower) rate of 71. These patterns (the decline, increase and stability over the past two decades) are not exclusive to adolescents but follow the overall fertility trends for the country.[4]
Stats SA regularly reports the number of ‘recorded live births’, using vital statistics data. The pattern over the past decade (from 2011) has been a decrease in adolescent births, this decrease being reflected in both the rate of current year birth registrations and late birth registrations. In 2023, out of 950,000 current-year births registered, 100,000 were registered to the mothers of adolescents aged 19 or younger.[5] The share of all births registered to teens up to 19 years was 12%, down from 16% of births that occurred a decade before.
Department of Health data between 2004 and 2019 showed a consistent decline in the share of teenagers aged 15 – 19 who attended antenatal clinics and participated in the national HIV sero-prevalence survey.[6] The share remained stable in 2022, with teens aged 15 – 19 representing 13% of participants in the antenatal survey, down from 17.5% in 2013). All of these data sources suggest that pregnancy and fertility rates among teenagers did not increase in last decade.
Fertility rates are, of course, an indicator of possible exposure to HIV. HIV prevalence rates are higher among women in their late twenties and thirties, and lower among teenagers, and the prevalence rate in the 15 – 24 age group has decreased over the past decade. However, prevalence rates are still worryingly high: of the young pregnant women surveyed in antenatal clinics in 2022, 7.6% of those aged 15 – 19 and 16.4% of those aged 20 – 24 were HIV positive.[7] For many years the majority of deaths in young mothers were caused by HIV.[8] Much of the overall decline in maternal deaths since 2011 is attributed to implementation of policies to manage and prevent HIV,[9] but it is still important that safe sexual behaviour is encouraged and practised.
Studies have found that early childbearing – particularly by teenagers and young women who have not completed school – has a significant impact on the education outcomes of both the mother and child, and is also associated with poorer child health and nutritional outcomes.[2][8][10] For this reason, it is important to delay childbearing, and to ensure that teenagers who do become pregnant are appropriately supported. This includes ensuring that young mothers can complete their education, and that they have access to parenting support programmes and health services. Although pregnancy is a major cause of school drop-out, some research has also suggested that teenage girls who are already falling behind at school are more likely to become pregnant than those who are progressing through school at the expected rate.[11] So efforts to provide educational support for girls who are not coping at school may also help to reduce teenage pregnancies.
Poverty alleviation is important for both the mother and child, but previous studies on take-up of the Child Support Grant (CSG) among teenage mothers have found that access is low compared with older mothers.3,[12][13] In 2024, fewer than 1% of the 7.5 million CSG beneficiaries (caregivers) were under 20 years old.[14] This suggests that greater effort should be made to assist young mothers to obtain identity documents for themselves and birth certificates for their babies so that they can apply for CSGs. Ideally, birth registration and social security services should form part of a comprehensive maternal support service at all maternity facilities.
Since 2009 the nationally representative GHS conducted by Stats SA has included questions on pregnancy and fertility. The pregnancy question asks the household respondent: “Has any female household member [between 12 – 50 years] been pregnant during the past 12 months?” For those reported to have been pregnant, a follow-up question asks about the current status of the pregnancy. This indicator calculates the number and percentage of young women who have given birth in the past year.
According to the GHS, the national childbearing rate for young women aged 15 – 24 was 5.4% in 2024. This is equivalent to 281,000 births to young women in this age group, out around 1 million births per year, according to the population models and represents a statistically significant decline since 7.7% in 2009 when the question was first asked in the survey.
As would be expected, childbearing rates increase with age. Only 2% of girls aged 15 – 17 were reported to have given birth in the previous 12 months (representing 41,000 teenagers in this age group). Childbearing rates rose to 6% among 18 – 20-year-olds (85,000 when weighted), and 8% in the 21 – 24 age group (155,000). This pattern has been been fairly stable over the past decade, and in the group defined as children (under 18) the childbearing rate has never risen above 3.2% (its peak in 2013).
This question was first introduced in the General Household Survey in 2009, and was omitted from the abridged survey in the lockdown years of 2020 and 2021. In 2022 the GHS reinstated the question about pregnancy but did not resume the question about the current status of the pregnancy.
It should be noted that questions on pregnancy are not necessarily asked of the young women themselves as questions about all household members are typically answered by the key respondent or household head. It is quite likely that there is reporting error in the pregnancy question in particular, as pregnancies might not yet be known or may be hidden from other household members. One would expect lower levels of error in reporting when children have been born alive. This indicators therefore presents trends on both pregnancy and childbirth.
The GHS uses a Master Sample frame which has been developed as a general-purpose household survey frame that can be used by all other Stats SA household-based surveys that have design requirements that are reasonably compatible with the GHS. The sample is drawn from Census enumeration areas using a stratified two-stage design with probability proportional to size sampling of PSUs in the first stage, and sampling of dwelling units with systematic sampling in the second stage. The resulting sample consists of just over 20,000 households with around 70,000 individuals, and should be representative of all households in South Africa. It is also designed to be representative at provincial level and within provinces at metro/non-metro levels and three geography types (urban areas, rural areas under traditional authority, and farms).
The sample consists of households and does not cover other collective institutionalised living-quarters such as boarding schools, orphanages, students’ hostels, old-age homes, hospitals, prisons, military barracks and workers’ hostels. These exclusions probably do not have a noticeable impact on the findings in respect of children.
Changes in sample frame and stratification
Since 2014 the GHS has been based on the 2013 master sample that that is, in turn, based on information collected during the 2011 Population Census. The previous master sample for the GHS was used for the first time in 2008, and the one before that in 2004. These again differed from the master sample used in the first two years of the GHS: 2002 and 2003. Thus there have been four different sampling frames during history of the annual GHS, with the changes occurring in 2004, 2008 and 2013. In addition, there have been changes in the method of stratification over the years. These changes could compromise comparability across iterations of the survey to some extent, although it is common practice to use the GHS for longitudinal monitoring and many of the official trend analyses are drawn from this survey.
Weights
Person and household weights are provided by Stats SA and are applied in Children Count analyses to give population estimates on the indicators. The GHS weights are derived from Stats SA’s mid-year population estimates for the relevant year. The population estimates are based on a model that is revised from time to time when it is possible to calibrate the population model to Census data and larger population surveys such as the Community Survey.
In 2017, Stats SA revised its demographic model to produce a new series of mid-year population estimates and the GHS data were re-released with the revised population weights. All the Children Count indicators were re-analysed retrospectively, using the revised weights provided by Stats SA, based on the 2013 model. The estimates are therefore comparable over all years. The revised weights particularly affected estimates for the years 2002 – 2007.
The 2017 model drew on the 2011 census, along with vital registration, antenatal and other administrative data, but was a “smoothed” model that did not mimic the unusual shape of the age distribution found in the census. The results of the 2011 census were initially distrusted because it seemed to over-count children in the 0 – 4 age group and under-count children in the 4 – 14-year group. It is now thought that the fertility rates recorded in the 2011 population census may have been an accurate reflection of demopraphic trends, with an unexplained upswing in fertility around 2009 after which fertility rates declined again gradually. Similar patterns were found in the vital registration data as more births were reported retrospectively to the Department of Home Affairs, and in administrative data from schools, compiled by the Department of Basic Education. In effect, this means that there may be more children in South Africa than appear from the analyses presented in these analyses, where we have applied weights based on a model that it is now known to be inaccurate.
Stats SA has subsequently developed a new population model - the 2022 series, which provides revised mid-year population estimates back to 2002 and projected to 2032. However, the GHS series has not yet been reweighted.The population estimates in Children Count are therefore based on weights derived from outdated population model (2017). It is not yet clear when and how the population model will be revised again following the 2022 Census, as there are concerns around census under-count and plausibility of its findings.
Disaggregation
Statistics South Africa suggests caution when attempting to interpret data generated at low level disaggregation. The population estimates are benchmarked at the national level in terms of age, sex and population group while at provincial level, benchmarking is by population group only. This could mean that estimates derived from any further disaggregation of the provincial data below the population group may not be robust enough.
Reporting error
Error may be present due to the methodology used, i.e. the questionnaire is administered to only one respondent in the household who is expected to provide information about all other members of the household. Not all respondents will have accurate information about all children in the household. In instances where the respondent did not or could not provide an answer, this was recorded as “unspecified” (no response) or “don’t know” (the respondent stated that they didn’t know the answer).
For more information on the methods of the General Household Survey, see the metadata for the respective survey years, available on Nesstar or DataFirst
Supported by


Previous Funders

46 Sawkins Road
Rondebosch, 7700
South Africa
Tel: +27 (0)21 650 1473
Email: info.ci@uct.ac.za